
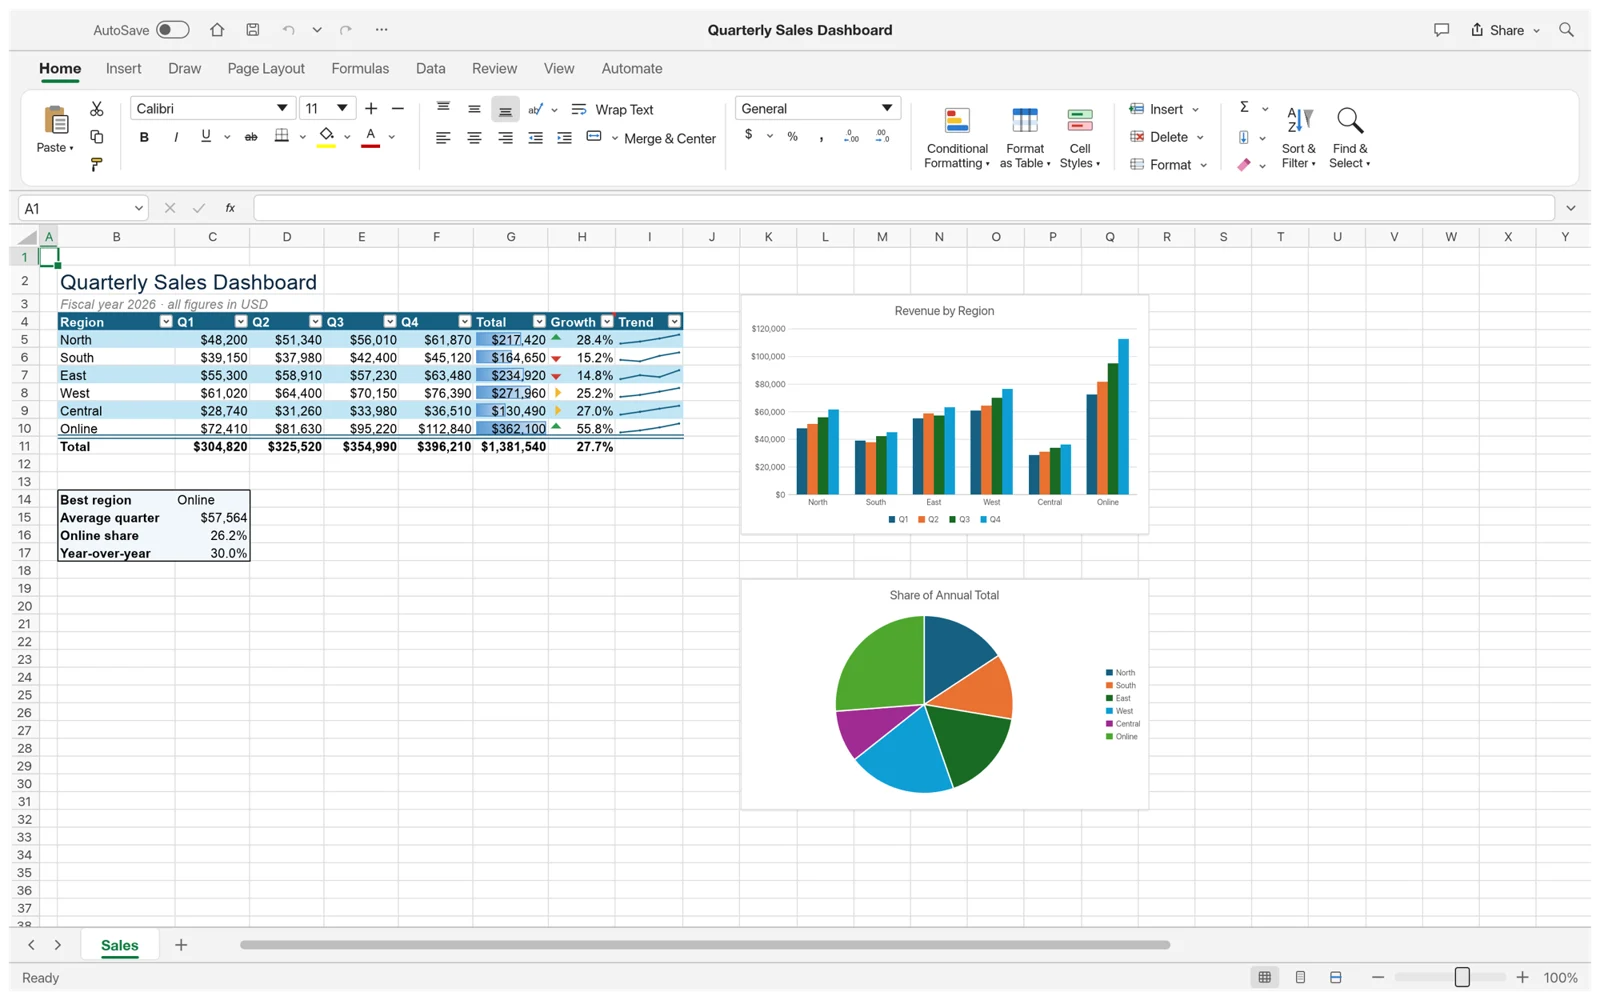
GridCraft is an open-source spreadsheet application built by ArtCraft in Rust. If you searched for “grid craft” or “gridcraft spreadsheet,” this is the Excel-style app for workbooks, formulas and charts. This site, gridcraft.me, is an independent guide and hosts the official v0.7.0 browser build.
The app, the project and this website
Use the ArtCraft project page and the storytold/gridcraft GitHub repository to identify the upstream software. The project publishes its source, release files and documentation there. This website adds a launch page and practical guides; it is not Microsoft Excel and is not the official ArtCraft website.
The open-source license allows use under MIT or Apache-2.0 terms. Downloading the app and using the browser build are different ways to run the software. Keep the version number with any notes about a feature: this guide describes the v0.7.0 build provided here, not every future release.
Find your way around the spreadsheet
A cell address combines a column letter and a row number. B4 means column B, row 4. The formula bar lets you inspect the selected cell’s contents, and the tabs along the bottom select worksheets. These three landmarks are enough to start exploring a sample without learning every ribbon command.
In a budget workbook, select a total to see whether it is a typed value or a formula. Then choose a nearby input cell, change one amount and watch the result. Undo the edit if you want to restore the sample. This connects the grid you see with the calculation behind it.
What can you do with GridCraft?
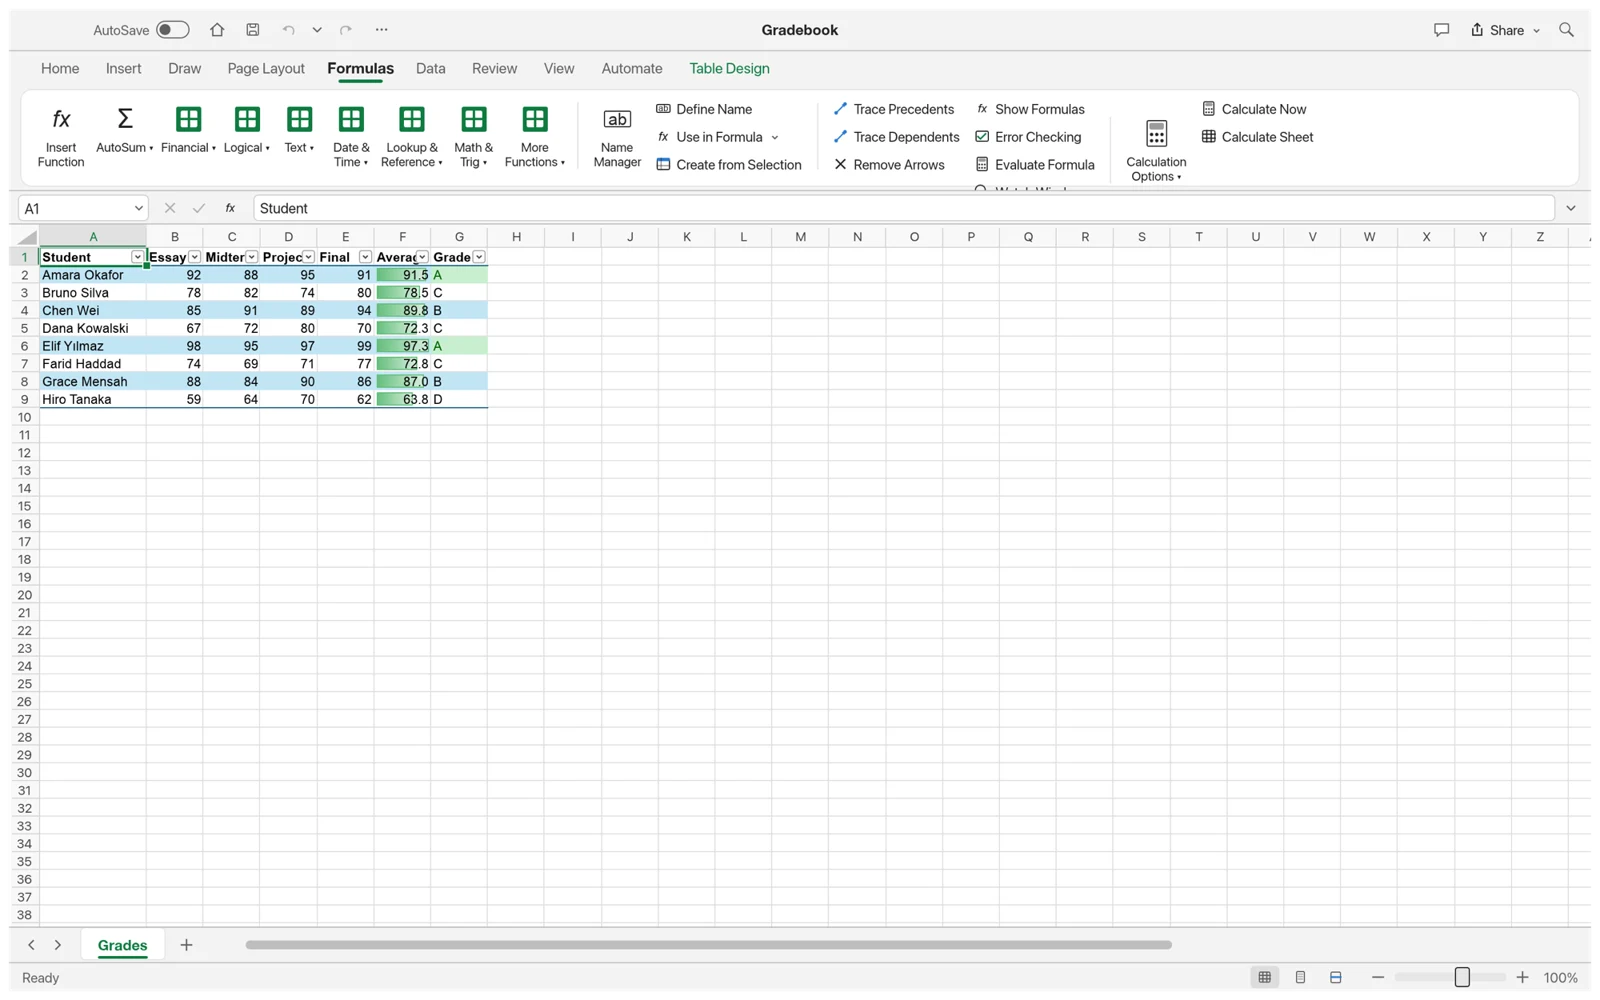
- Organize tabular data: keep one kind of value in each column and one record on each row. A clear header row makes sorting, filtering and reviewing much easier.
- Calculate results: use formulas for totals, comparisons and summaries. Begin with a result you can check by hand before relying on a larger model.
- Make the data readable: format numbers consistently and use a chart when it helps answer a specific question, such as which category changed the most.
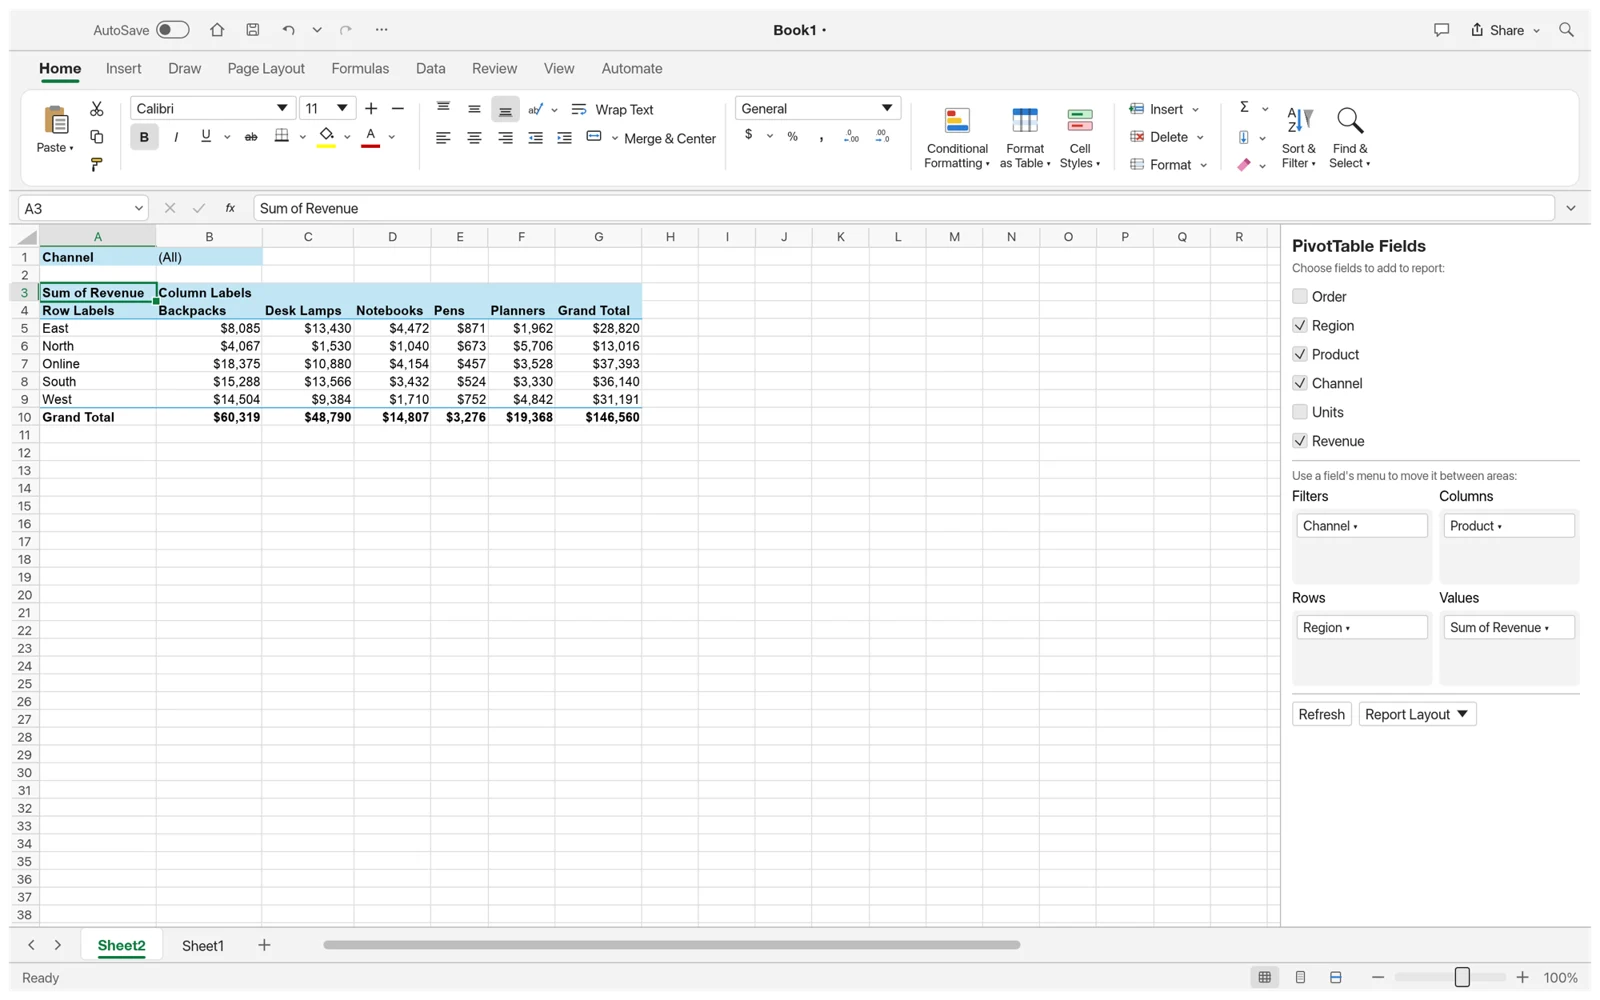
- Summarize records: explore the sales sample and the PivotTable guide to compare groups without manually adding every row. Check the source range and totals.
Choose online or desktop
For a desktop download, match the operating system and CPU architecture instead of choosing the first asset in a release. The homepage links to the pinned v0.7.0 packages; the upstream releases page may offer newer builds. Read the release notes if you choose a different version.
| Your next step | A useful starting point |
|---|---|
| Try the interface without installing | Launch a sample in the online editor. Save a file before closing the session. |
| Work regularly with local files | Review the desktop downloads and select the build for your operating system and processor. |
| Move a workbook from Excel | Test an independent copy, save it and reopen in Excel before changing your usual workflow. |
| Inspect or contribute to the project | Use the official repository and the documentation for the release you are reviewing. |
Give your first session one clear goal
- Choose one sample: budget for amounts, grades for formulas, or sales for charts and summaries.
- Find one input and one result that depends on it. Write down what should happen when you change the input.
- Make the edit, inspect the result and save a new workbook. Reopen that saved file to confirm that the change was retained.
- Only then try a copy of your own file. Keep a list of missing features or differences that matter to your actual task.
A concrete example: plan a small workshop
Imagine that you are organizing a workshop and need to track three supplies. Create columns for Item, Quantity, Unit cost and Line total. Use one row for each supply, and keep the quantity and unit cost as separate numeric inputs. This structure is more useful than typing a finished total into every row because you can change attendance or prices without rewriting the entire sheet.
Start with notebooks, markers and folders. If the quantities are 12, 3 and 12, and the unit costs are 4, 6 and 2, the line totals should be 48, 18 and 24. The combined amount is 90. Enter the formulas shown below, then increase the notebook quantity from 12 to 15. The notebook total becomes 60 and the combined amount becomes 102. Those expected results give you a simple check.
Once the numbers behave as expected, apply a consistent number format and save the workbook. Reopen the saved file and repeat the quantity change. You have now practiced the essential loop: structure inputs, calculate results, make a controlled edit and keep a reusable file. The exercise also shows why a spreadsheet is different from a static table in a document.
A1: Item        B1: Quantity   C1: Unit cost   D1: Line total
A2: Notebooks   B2: 12         C2: 4           D2: =B2*C2
A3: Markers     B3: 3          C3: 6           D3: =B3*C3
A4: Folders     B4: 12         C4: 2           D4: =B4*C4
A5: Total D5: =SUM(D2:D4)Choose a download without guessing
Check your operating system first, then your processor architecture. A Windows x64 package and a Linux x86_64 package are not interchangeable even if the computers use similar processors. On a Mac, the pinned universal package covers Apple silicon and Intel. If you are uncertain about your machine, read its system information rather than inferring the architecture from the computer’s age or appearance.
Use the homepage download section as a starting point, then check the official release page for the filename and version. Keep the installer version in your notes. If you later report an issue or compare a desktop behavior with this site’s online editor, knowing whether both are v0.7.0 avoids confusing an upgrade with a platform difference. Downloading a newer release does not update an already open browser session.
For an initial evaluation, you do not need to install every edition. Try one representative workbook in the environment you expect to use. If the browser sample already reveals a missing requirement, investigate that requirement before spending time configuring another device. If the sample works well, a desktop trial can help you evaluate the repeated open, edit and save routine.
Learn in the order your workbook needs
Begin with data entry and saving. Then learn cell references and a few formulas that solve your immediate problem. After the calculations are correct, use number formats and column widths to make the sheet easier to read. Add a chart only when you can name the question it answers. This order keeps a polished-looking sheet from hiding an incorrect calculation or an unsaved file.
Move on to filters and PivotTables when the number of records makes manual inspection awkward. Before summarizing, make sure each column contains a consistent kind of value and the header row is clear. A pivot can help answer which region contributed the most revenue, but it cannot fix a source table in which quantities, labels and notes are mixed in the same column.
What should you know before relying on it?
Is GridCraft ready to replace every Excel workbook?
No. The build covered here is alpha software. Small successful examples do not establish compatibility with large models, advanced objects or automation. Use the comparison guide and check the files you actually need.
Do I need a desktop app to try GridCraft?
No. The online editor lets you launch the browser build and work with a sample. A desktop browser with a keyboard is a more practical way to explore a full spreadsheet than a narrow phone screen.
What is the difference between a workbook and a worksheet?
A workbook is the file you open and save. It can contain several worksheets, each represented by a sheet tab. When checking an imported file, inspect more than the first worksheet: other sheets may contain inputs, lookup data or formulas that the visible summary depends on.
Can I learn with GridCraft before moving my own files?
Yes. The supplied samples let you inspect a finished workbook and make reversible edits. Use the small workshop example for a second exercise, then try an independent copy of a file you understand. Keep the learning session separate from the original file you depend on for real work.
Sources and version notes
Feature details refer to the linked version. Follow the upstream release notes when using a different build.