
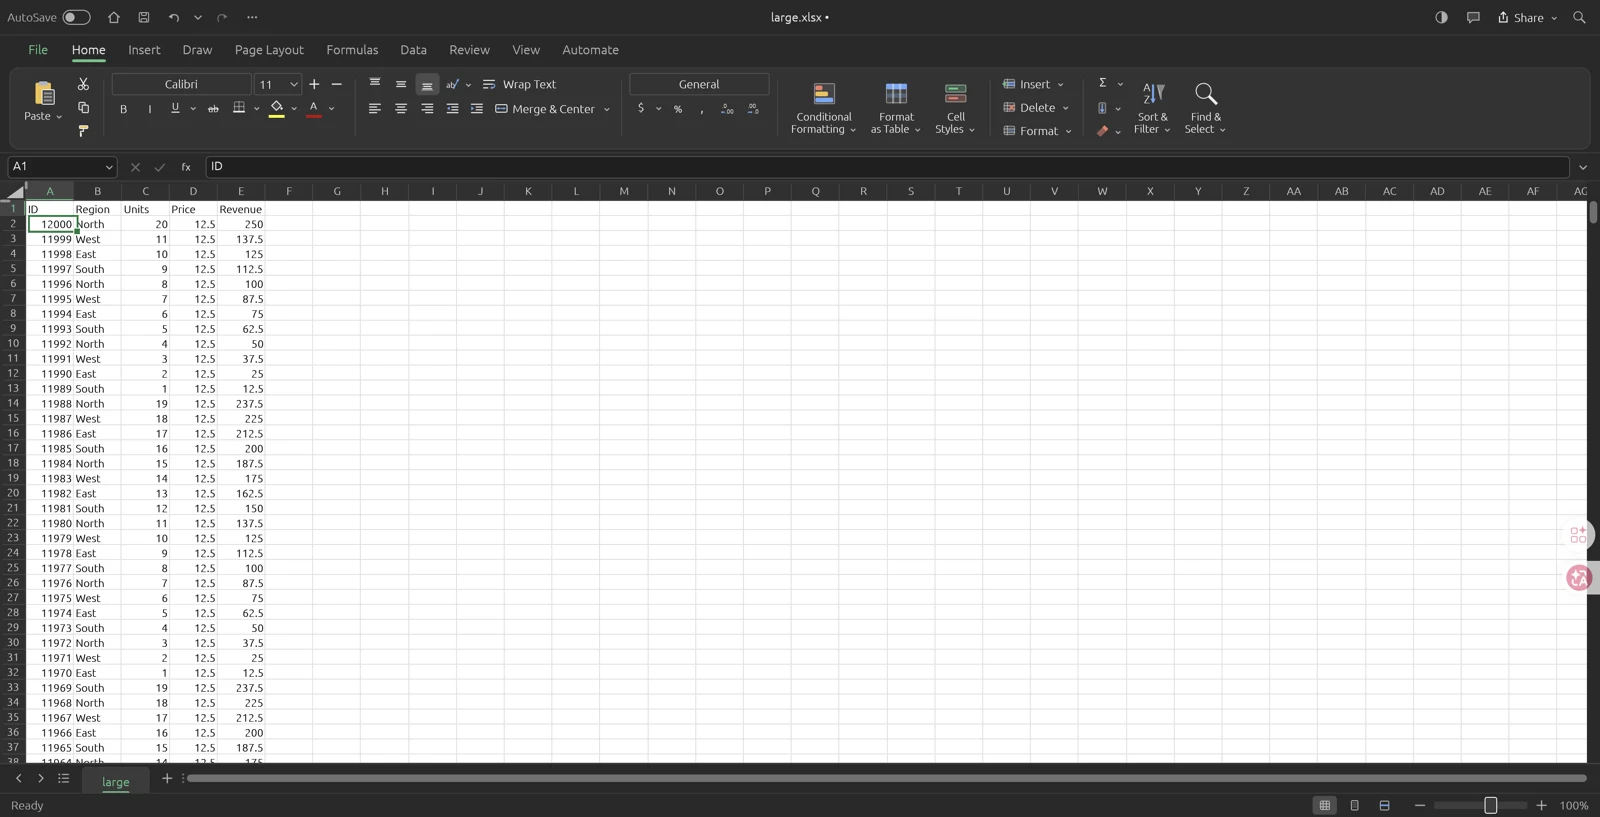
A row count is useful context, but it does not describe the whole workload. We opened a synthetic 12,000-record workbook in the official GridCraft v0.19.1 browser build, served locally and operated in Tabbit on macOS on November 13, 2026. This is a qualitative spot check of one environment. We report responsive operations and noticeable waiting rather than presenting a universal speed score or a promise about your device.
What was in the test workbook
The sheet had five columns: ID, Region, Units, Price, and Revenue. It contained 12,000 data rows plus the header, so its used range was A1:E12001 and it held 60,005 cells. Regions repeated North, South, East, and West; units varied; the price was 12.5. Revenue used a simple same-row multiplication. There were no images, pivot tables, charts, merged cells, conditional-format rules, or external links in this test.
We first prepared the values as CSV and converted them to XLSX with the v0.19.1 CLI. The formula-looking CSV fields were text on import, so we explicitly entered =C2*D2 in E2 and used Fill Down through E12001. That correction matters: scrolling a sheet of text would not test a workbook with 12,000 active arithmetic formulas. We checked the final formula results before drawing any conclusions.
What felt responsive, and what involved waiting
Opening the workbook completed and the grid remained usable. Wheel scrolling and Page Down moved the viewport without an obvious sustained stall in our spot checks. Selecting a distant cell and editing one input also completed without a disruptive wait. These observations describe the interactions we checked; screenshots alone cannot establish perfectly smooth animation throughout a long session.
Bulk filling the entire formula column was noticeably heavier than editing one cell. There was a clear wait before the command finished and the updated values could be checked. After the fill completed, normal navigation remained responsive. Treat a large batch operation as a different workload from moving around an already calculated sheet.
At the end of the sheet, changing Units to 20 produced Revenue 250 with Price 12.5. Sorting all five columns by ID descending also completed without a disruptive stall in this sample. We checked that the first records were 12000, 11999, and 11998 and that their units, prices, and revenues stayed together. A visually sorted ID column alone would not establish that the complete rows were sorted correctly.
| Operation | Qualitative observation |
|---|---|
| Open the 12,000-record XLSX | Completed; grid usable |
| Wheel scroll and Page Down | Responsive in spot checks |
| Fill 12,000 arithmetic formulas | Noticeable waiting during the bulk operation |
| Edit one input near the last row | Responsive; dependent revenue updated |
| Sort complete rows by ID | Completed responsively in this sample |
What this result does not establish
This workbook was narrow and deliberately simple. Thousands of lookup formulas over wide ranges, many chart objects, elaborate conditional formatting, or a deep chain of dependent sheets can create a very different workload at the same row count. We did not run a long-duration stability test, a mobile test, or a comparison against Excel on identical hardware.
The browser build was a separate local v0.19.1 test installation. Check the version shown by this website’s embedded editor before treating it as the same build. Browser graphics support, available memory, other open tabs, and desktop versus web packaging can affect the experience. Do not turn one successful sample into a general recommendation to move a critical workbook without checking its actual operations.
Repeat the checks with a copy of your own workbook
Start by writing down the used range, formula count or approximate density, and the features that matter to your workflow. Open a copy, navigate between distant rows, edit a source value, sort a complete table, and run the most common report operation. Check correctness after each action. Keep the same application version and similar background workload when comparing two versions.
Use descriptions that another person can understand: navigation remained responsive; a bulk fill caused a noticeable wait; a calculation left the interface unresponsive; reopening lost a feature. Separate initial loading, ordinary navigation, bulk edits, and recalculation. Averaging those experiences into one claim hides the part that may matter most to your work.
If a workbook struggles, reduce one source of complexity at a time on a copy. Compare a values-only sheet with the formula version, then add formatting and objects back. Keep referenced ranges as focused as the calculation allows, and save before expensive structural edits. A small reproducible workbook is more useful for an upstream report than a vague statement that “large files are slow.”
Sources and version notes
Feature details refer to the linked version. Follow the upstream release notes when using a different build.