
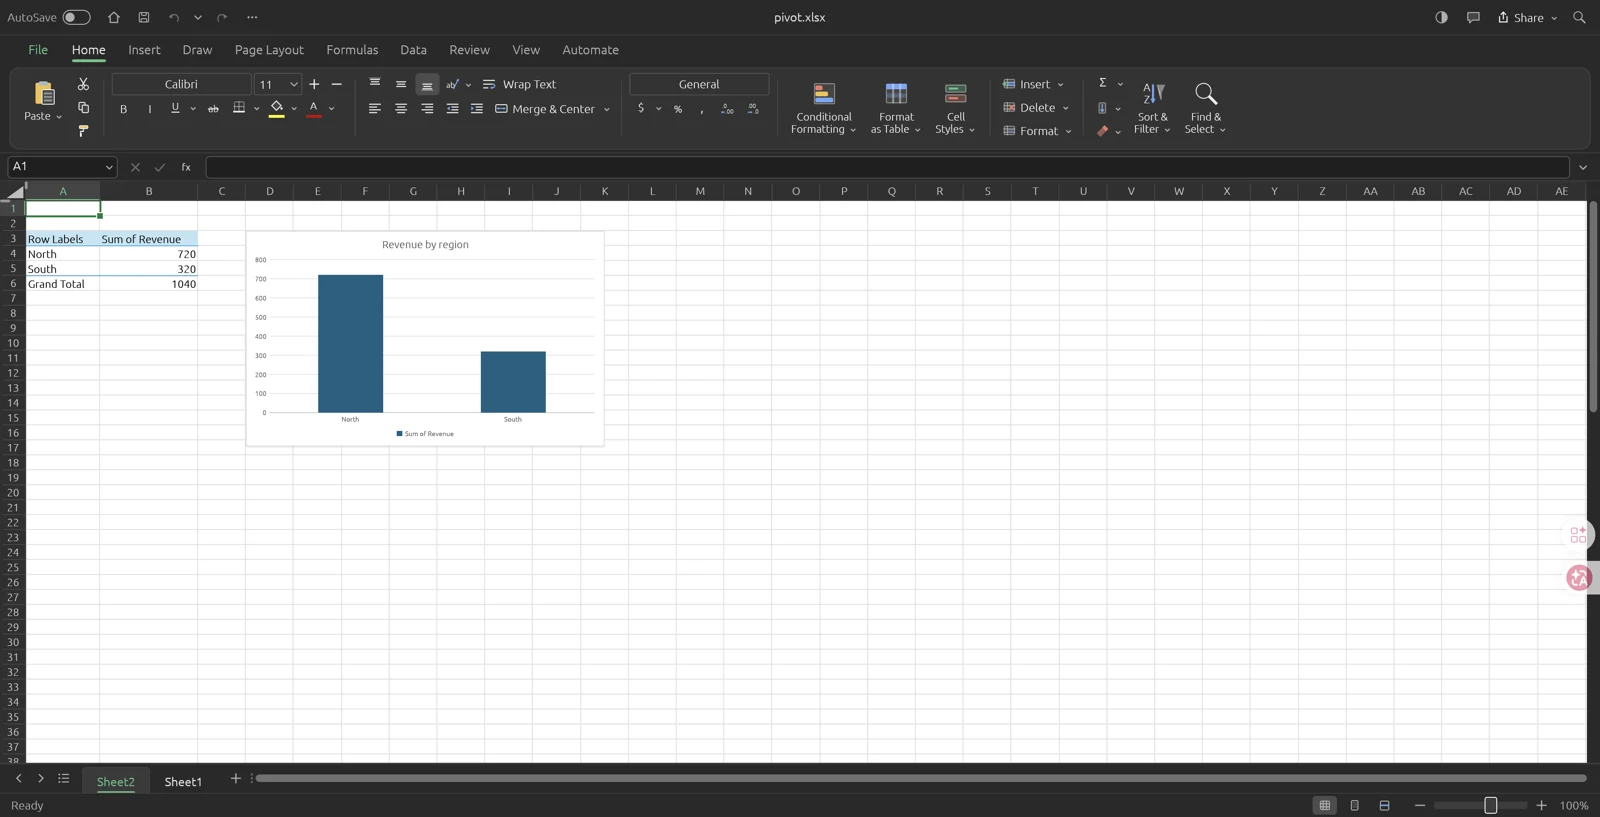
A useful first PivotTable is small enough to verify without trusting the software. We created the following report with GridCraft v0.19.1 commands, saved it as XLSX, and opened the exported workbook in the v0.19.1 browser build in Tabbit on macOS. The summary cells and the North/South column chart were visible after reopening. The example is intentionally modest: it tests the path from source rows to a saved report, not every pivot feature.
Prepare a rectangular source table
Use one header row with Region, Product, and Revenue in A1:C1. Add North / Studio / 480, South / Studio / 320, and North / Workshop / 240. Keep Revenue numeric. Do not add a precomputed grand-total row to the source: a pivot could count that row along with the original records and double the revenue.
For a first attempt, avoid merged headings, blank header cells, and decorative notes inside the data rectangle. Those choices make it harder to tell which field is being summarized. Before inserting anything, calculate the expected answer: North is 480 + 240 = 720, South is 320, and the complete dataset sums to 1,040. Write those checks beside your working notes.
Region   Product    Revenue
North    Studio     480
South    Studio     320
North Workshop 240Create the report and choose Sum
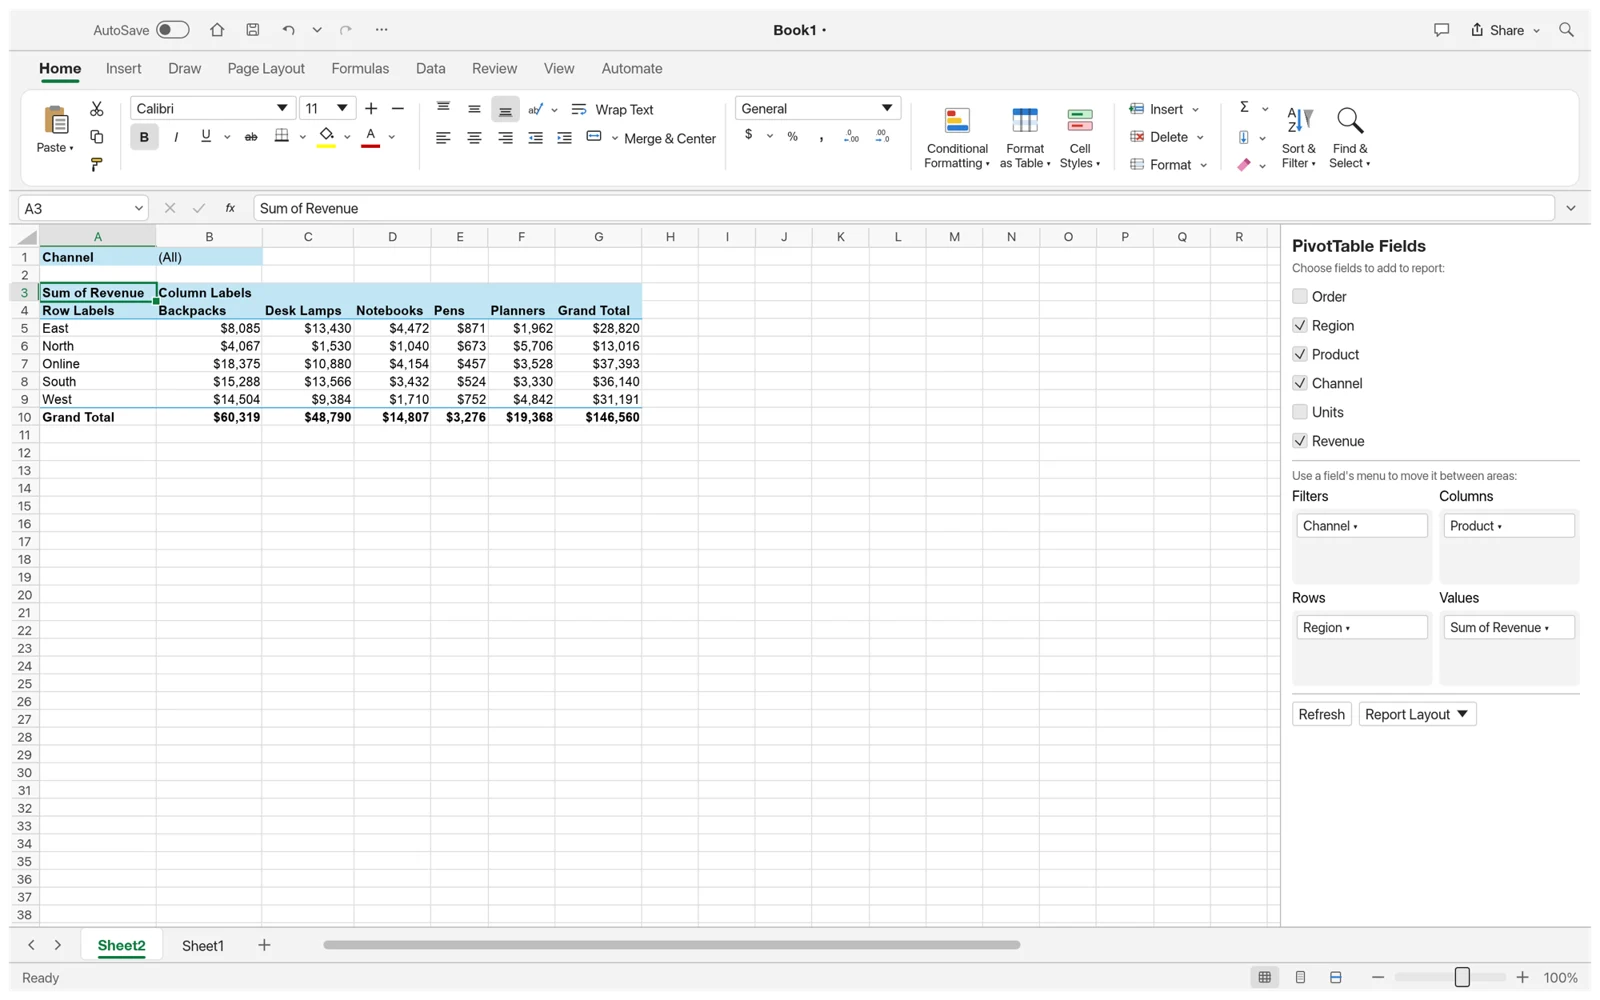
Select the source rectangle and use Insert > PivotTable. Choose a new sheet for the destination so the summary cannot overwrite the original rows. Put Region in Rows and Revenue in Values. Check that the value field uses Sum, because a count of records answers a different question. The field list is the place to inspect which fields are assigned to each area.
Our reproducible command used source Sheet1!A1:C4, rows ["Region"], and a Revenue value field with func "sum". GridCraft created a new sheet, placed the report at A3:B6, and named the value column Sum of Revenue. The results matched the hand calculation. Keeping this exact source range in the test makes it clear which records were included.
| Report row | Observed Sum of Revenue |
|---|---|
| North | 720 |
| South | 320 |
| Grand Total | 1,040 |
Turn the summary into a column chart
Select a cell in the report and choose Insert > PivotChart. Use a column chart with a descriptive title such as Revenue by region. This gives you a compact comparison of the two regions. Keep the unit clear; a number without a currency or other business context may be mathematically correct but confusing to the reader.
In the tested command workflow, insert.pivotChart referenced the named RevenueByRegion pivot and returned one chart with one series. After saving and reopening the XLSX file in the browser build, the chart showed North and South alongside the report. The grand total stayed in the summary table rather than becoming a third region in the pictured chart. That visual check matters: the report can be correct while the chosen chart categories are misleading.
Check the source and refresh deliberately
When you change the original data, refresh the PivotTable and compare the new total with the source again. A fixed range such as A1:C4 does not describe a new record on row 5. Check Change Data Source or use a correctly defined table before assuming the next refresh includes appended rows. The v0.19.1 command catalog provides pivot.refresh and pivot.changeSource; the saved-file check above did not exercise every combination of source expansion and filters.
If the summary looks wrong, inspect the source range first, then the aggregation function and active filters. A text-looking number can also change which summaries are meaningful. Keep a small unfiltered report as a reference while experimenting with Product in Columns or additional value fields. Save a working copy before changing a report that somebody else relies on.
Finally, reopen the exported workbook and verify the labels, values, and chart. If the destination is Excel, perform that final check in Excel too; our test verified reopening in GridCraft only. A successful GridCraft round trip is useful evidence, but it is not a substitute for testing the actual recipient’s application.
Sources and version notes
Feature details refer to the linked version. Follow the upstream release notes when using a different build.